The Restaurant Industries Delusion
There's a seductive simplicity to the 30/30/30/10 rule in hospitality. And it's quietly destroying operators who mistake a teaching aid for a business model.
IVAN BREWER


One-size fits all insanity
It's like a stock photo of a restaurant kitchen: it looks professional, but it's nobody's actual workspace. A snapshot of an idealised cost structure that reflects no single real venue.
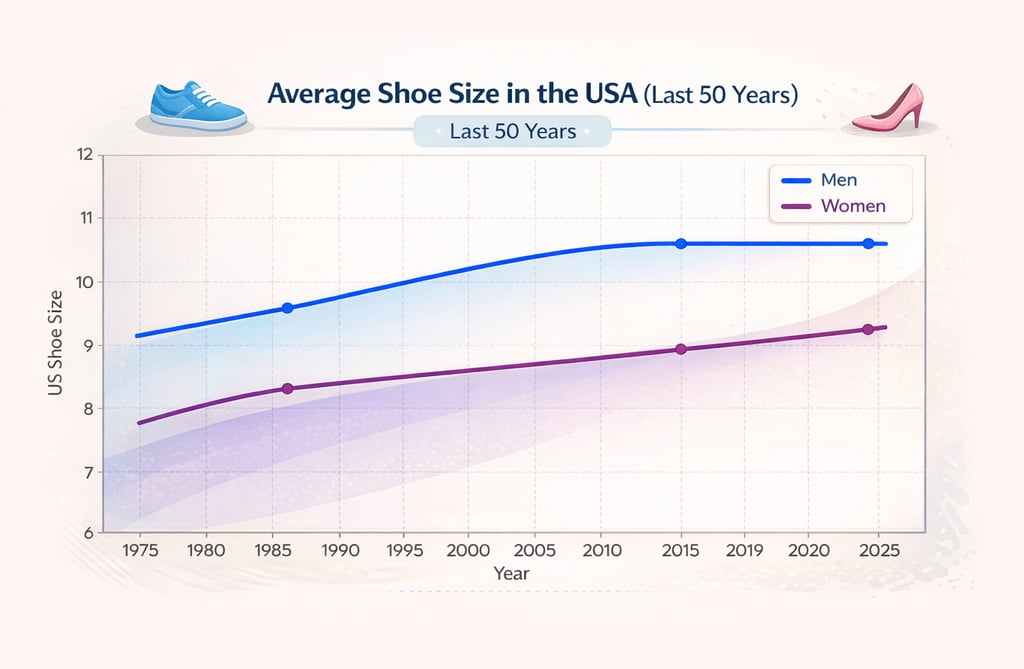
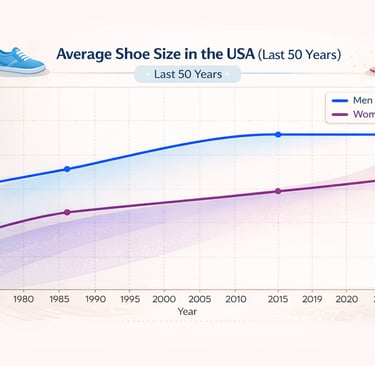
Imagine you've recently taken over a shoe manufacturer. You want to situate your new business in a broader context, so you look for benchmarks. A LinkedIn post tells you the average shoe size in the USA is Size 8 for women, Size 10 for men. A quick Google search confirms it. Pages of insights.
In your next management meeting, you propose the plant now focus exclusively—all brands—on Size 8 and Size 10.
Your plant manager sits quietly through the meeting, then pulls you aside.
Sit down, he says. And listen.
The Rule Isn’t a rule - It’s a framework
Those "average sizes" come from data thirty to forty years old. And "average" is meaningless anyway by definition, it doesn't represent what the shoe-wearing public actually wears. Most of our customers need something different.
"We really don't have to think too hard about this to realise it's nonsense"
Start with the end in mind - Profit First
Profit-first is essential to running a successful venue. But achieving that profit requires a deeper understanding than simply following the 30/30/30 rule, looking beyond fixed percentages and focus on what truly drives profitability; variable revenues, capacity utilization, productivity, smart pricing, menu optimization, and disciplined cost management. It’s not about fitting everything into neat boxes, but about actively managing the variables that impact your bottom line.
"Swap Shoe Manufacturer for Restaurant Industry, and the same thing applies"
Stop Targeting 30% Labor Cost: Why It's Breaking Your Business
You're not failing - your benchmark is.
For decades, operators have been told that labor should run 30% of revenue. It's gospel. It's what accountants expect. It's what consultants preach. And in the 1980s and 1990s, when that rule was written, it worked. Kinda.
But in modern Australian & Global markets - where labour is no longer "cheap", and weekend penalty rates scale wage premiums, where revenue concentrates into Friday-Sunday spikes, where delivery commissions act as second rent - a flat 30% labor target isn't just difficult. It's structurally impossible. And totally irrelevant.
The inherited 30/30/30 ratio (30% Food Cost, 30% Labor, 30% Profit) assumes all venues are identical, that revenue is evenly distributed across the week, and that labor is cheap and abundant. None of those conditions exist anymore.
Contemporary Reality for Restaurants
Attempting to maintain 30% labor during weekday service - when 40% of weekly revenue is spread across four days trading - forces impossible trade-offs: both understaffing low-demand periods (suppressing revenue and service quality) AND overstaffing peak Friday, Saturday and Sunday shifts (destroying margin on low-volume days).
Because peak trading days MUST subsidise the low week day trade - with a labour cost of 19% to 23% on Friday and Saturday.
"The benchmark that was meant to ensure profitability now creates the conditions that prevent it."
A comprehensive analysis of the 2024-2025 economic landscape, reveals that this rule is no longer merely a benchmark - it is a damaging myth.
The rigid application of the 30/30/30 framework fails to account for the structural explosion in labor costs, the volatility of supply chains, and the critical role of specific unit economics, such as kitchen ergonomics, staff skillsets and experience, concept maturity and equipment efficiency.
"By forcing diverse business models into a standardized yesteryear template, the rule drives operators toward understaffing, service degradation, and ultimately, insolvency"
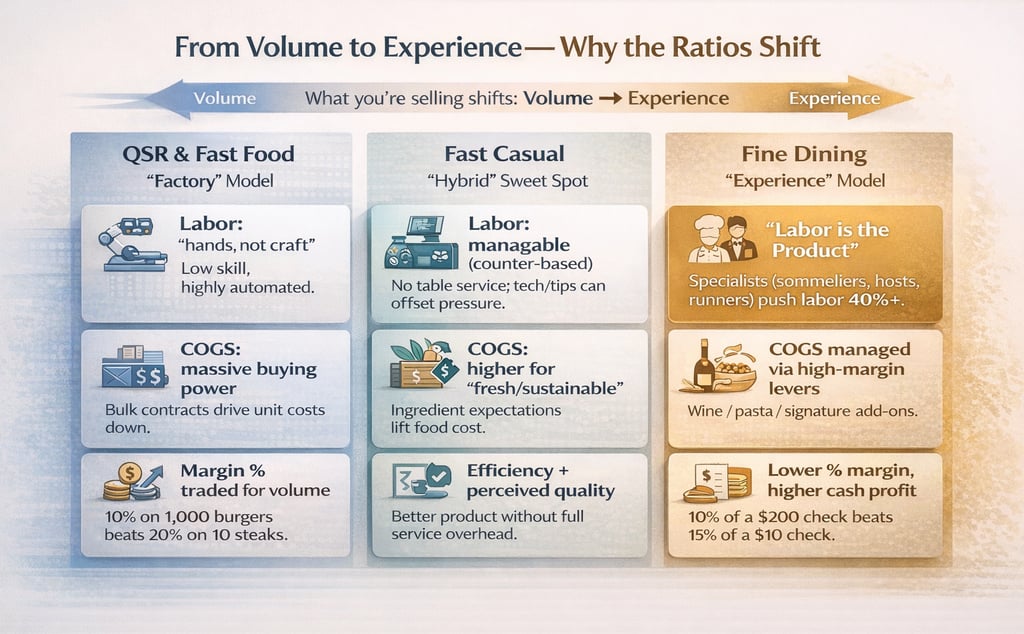
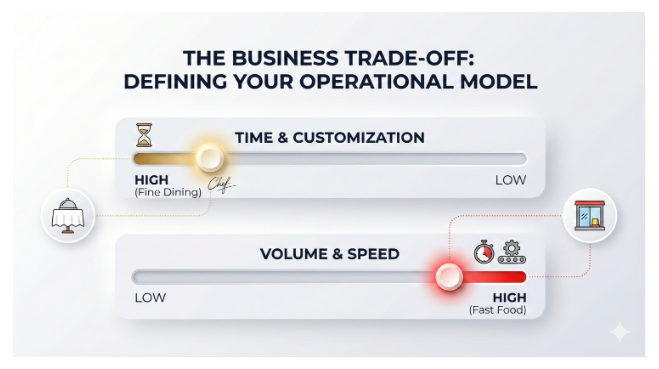
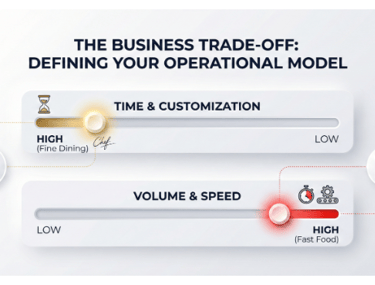
QSR & Fast Food (The "Factory" Model)
The Logic: High(er) COGS, low average spend, low labour
Labor: Low skill, highly automated. You are paying for "hands," not "craft."
COGS: Buying power, ability to negotiate delivery fees
Reality: They trade margin percentage for volume. A 10% margin on 1,000 burgers is better than 20% on 10 steaks.
Fast Casual (The "Hybrid" Sweet Spot)
The Logic: Better food than QSR, but service is still counter-based (low labor), higher average spend (higher priced items)
Labor: Remains manageable because there is no table service. Lower skilled, no qualified chefs (or few) or tech replaces order-takers (kiosks/QR).
COGS: Slightly higher because customers demand "fresh" or "sustainable" ingredients.
Fine Dining (The "Experience" Model)
The Logic: This is where 30/30/30 was never feasible.
Labor is the Product: You are not just selling food; you are selling service. You have sommeliers, hosts, runners, and highly skilled chefs. Labor often spikes to 40%+.
The Trade-off: COGS are driven down, as raw ingredients are transformed through labour, rent and fit-out are higher (and must be refreshed more frequently), fewer table-turns, but high average spend
Why the Ratios Shift
Failure Modes
The "Roster Slasher" Spiral:
Misuse: An operator sees labor at 34% on Tuesday. To hit 30%, they cut the runner and the dishwasher.
Outcome: Service collapses, table turnover slows, revenue drops. Fixed costs (rent) now eat a larger % of sales. The operator cuts more staff.
Guardrail: "Budget labor in dollars based on forecasted covers, not as a fixed percentage of sales."
The "Ingredient Cheapskate":
Misuse: An operator sees COGS at 35% (normal for their steakhouse). They switch to frozen steaks to hit 30%.
Outcome: Quality plummets, "craveability" is lost, customers leave.
Guardrail: "Use Prime Cost (COGS + Labor) to balance high food costs with efficient labor, rather than forcing both buckets down."
The "Paper Profit" Bankrupt:
Misuse: An operator hits 30/30/30/10 perfectly on the P&L. They assume the business is healthy and withdraw dividends.
Outcome: They fail to account for loan principal repayments and GST/VAT bills (which are not P&L expenses). The business runs out of cash despite being "profitable."
Guardrail: "Manage Solvency via Cash Flow Forecasts, not just P&L Ratios."
The "Burnout Factory":
Misuse: To keep hourly labor at 30%, the salaried owner/manager works 70 hours a week covering gaps.
Outcome: The manager burns out and quits. The owner must hire two people to replace them, spiking labor to 40% overnight.
Guardrail: "Calculate 'Shadow Labor Cost' - the cost if everyone, including owners, were paid market rates."
The "False Comparison":
Misuse: A fine-dining operator compares their labour % to a Subway franchise benchmark found online.
Outcome: They believe they are failing, leading to destructive panic-changes in a working business model.
Guardrail: "Benchmark against concept-specific peers (e.g., fine dining vs. fine dining), not industry averages", AND define your ven ues own, unique cost and profit structure.
The Honest Conversation
The 30/30/30 rule persists because it offers certainty in an industry defined by variance. It gives nervous operators something to hold onto.
But certainty isn't the same as accuracy. And a comfortable framework that leads you to misdiagnose your own business is worse than no framework at all.
The skill isn't memorising ratios. It's knowing which ratios matter for your venue, your market, your model-and having the financial fluency to adapt when conditions shift.
That's harder than 30/30/30/10. It's also closer to the truth.
What Sound Financial Thinking Actually Requires
Goal-based. What profit and cashflow do you actually need, given your capital structure and life circumstances? Start with the end in mind - profit first - then work backwards.
Constraint-aware. What are the genuine floors on your costs? Wages, rent, awards, capacity. These aren't negotiable. Your model has to accommodate them, not pretend they'll flex to fit a percentage.
Dynamic. How do your ratios shift with volume, mix, channel, and time? Your cost structure is an output of your concept, market, and stage of business. It's built on assumptions that should be constantly reviewed and revised.
Prime Cost + Peak Design
Forget individual line items. The only ratio that respects your actual business model is Prime Cost: COGS (Cost of Goods Sold) + Labor combined as a percentage of Net Sales.
The rule: Prime Cost must stay below 70% to ensure solvency.
This reframe unlocks two critical insights:
The Operational See-Saw
Your concept dictates your cost structure. A steakhouse running 42% Food Cost can operate profitably at 23% Labor (simplified prep, minimal staff, higher average spend). A fast-casual pasta concept running 25% Food Cost can afford 35% Labor (more complex service, higher touch). Both hit Both work.
The 30/30/30 rule would declare one of them "broken." Prime Cost reveals both provide an opportunity for success - they've just chosen different trade-offs between product quality and service complexity.
Weekly Prime Cost Management
You don't need to hit 30% labor every day. You need to average 70% Prime Cost over the week.
This allows you to:
Run 21% labor on a high-revenue Saturday (when peak volume drive efficiency)
Run 45% labor on a quiet Tuesday (when baseline coverage suffices)
You're managing to capacity and demand patterns, not fighting a daily percentage target that ignores your actual operating reality.
Operator Playbook - How to build foundational understanding of Prime Cost
Owner/GM – Days 1-2 (Monday planning):
Pull last week's sales and wage data. Calculate actual Prime Cost (COGS% + Labor%). Done when: you have a single percentage figure for the week.
GM/Operations Manager – Day 3 (Tuesday roster build):
Build next week's roster based on forecasted covers and Prime Cost target (not daily labor%). Allow higher labor% on forecast peak days if weekly average stays below 70%. Done when: roster is published with expected Prime Cost per day annotated.
Head Chef/Kitchen Manager – Days 1-7 (Daily):
Track daily COGS variance. If a day runs +3% over target Food Cost, flag it immediately - don't wait for weekly reporting. Done when: variance log is updated before close each night.
Owner/GM – Day 8 (Monday review):
Compare actual vs. target Prime Cost. If weekly actual exceeds 70%, identify the driver (waste spike? roster creep? sales miss?) and implement correction for next week. Done when: action plan is documented and communicated to department heads.
Finance/Bookkeeper – Monthly:
Audit three-month rolling Prime Cost trend. If trend is climbing (e.g., 60% → 61.5% → 63%), escalate to ownership for strategic intervention (menu pricing review, labor model redesign, or concept pivot). Done when: trend report and recommendation are delivered.
Further Reading
Myth of labor-cost percentages. Cornell Hotel and Restaurant Administration Quarterly.
Performance Gap Between Korean And U.S. Hospitality Firms: A Preliminary Examination Based On 2006 DATA. The Journal of Hospitality Financial Management, DOI: 10.1080/10913211.2008.10653859
Do food and beverage cost-control measures increase hotel performance? A case study in Istanbul, Turkey. Journal of Foodservice Business Research, DOI: 10.1080/15378020.2018.1493893
Costos operativos del área de alimentos y bebidas para mantener la rentabilidad de los establecimientos de restauración. International Journal of Professional Business Review, DOI: 10.26668/businessreview/2024.v9i8.4807
Effects of restaurant expenses on enhanced profitability: Do Michelin-starred restaurants perform differently? International Journal of Gastronomy and Food Science, DOI: 10.1016/j.ijgfs.2023.100811
Why Restaurants Fail. Retrieved from https://daniels.du.edu/assets/research-hg-parsa-part-1-2015.pdf
Facts over Folklore - insights that make a difference today
Join over 1000 operators recieving weekly insights